After posting on TreeMaps twice before (TreeMap of the Market and original post here) I wanted to better understand how they can be implemented.
In his book “Visualize This” – which we reviewed here – author Nathan Yau has a short chapter on TreeMaps, which he also published on his FlowingData Blog here. He is working with the statistical programming language R and uses a library which implements TreeMaps. While this allows for very easy creation of a TreeMap with just a few lines of code, from the perspective of how the TreeMap is constructed this is still a black box.
I searched for existing implementations of TreeMaps in Mathematica (which I am using for many visualization projects). Surprisingly I didn’t find any implementations, despite the 20 year history of both the Mathematica platform and the TreeMap concept. So I decided to learn by implementing a TreeMap algorithm myself.
Let’s recap: A TreeMap turns a tree of numeric values into a planar, space-filling map. A rectangular area is subdivided into smaller rectangles with sizes in relation to the values of the tree nodes. The color can be mapped based on either that same value or some other corresponding value.
One algorithm for TreeMaps is called slice-and-dice. It starts at the top-level and works recursively down to the leaf level of the tree. Suppose you have N values at any given level of the tree and a corresponding rectangle.
a) Sort the values in descending order.
b) Select the first k values (0<k<N) which sum to at least the split-ratio of the values total.
c) Split the rectangle into two parts according to split-ratio along its longer side (to avoid very narrow shapes).
d) Allocate the first k values to the split-off part, the remaining N-k values to the rest of the rectangle.
e) Repeat as long as you have sublists with more than one value (N>1) at current level.
f) For each node at current level, map its sub-tree onto the corresponding rectangle (until you reach leaf level).
As an example, consider the list of values {6,5,4,3,2,1}. Their sum is 21. If we have a split-ratio parameter of say 0.4, then we split the values into {6,5} and {4,3,2,1} since the ratio (6+5)/21 = 0.53 > 0.4, then continue with {6,5} in the first portion of the rectangle and with {4,3,2,1} in the other portion.
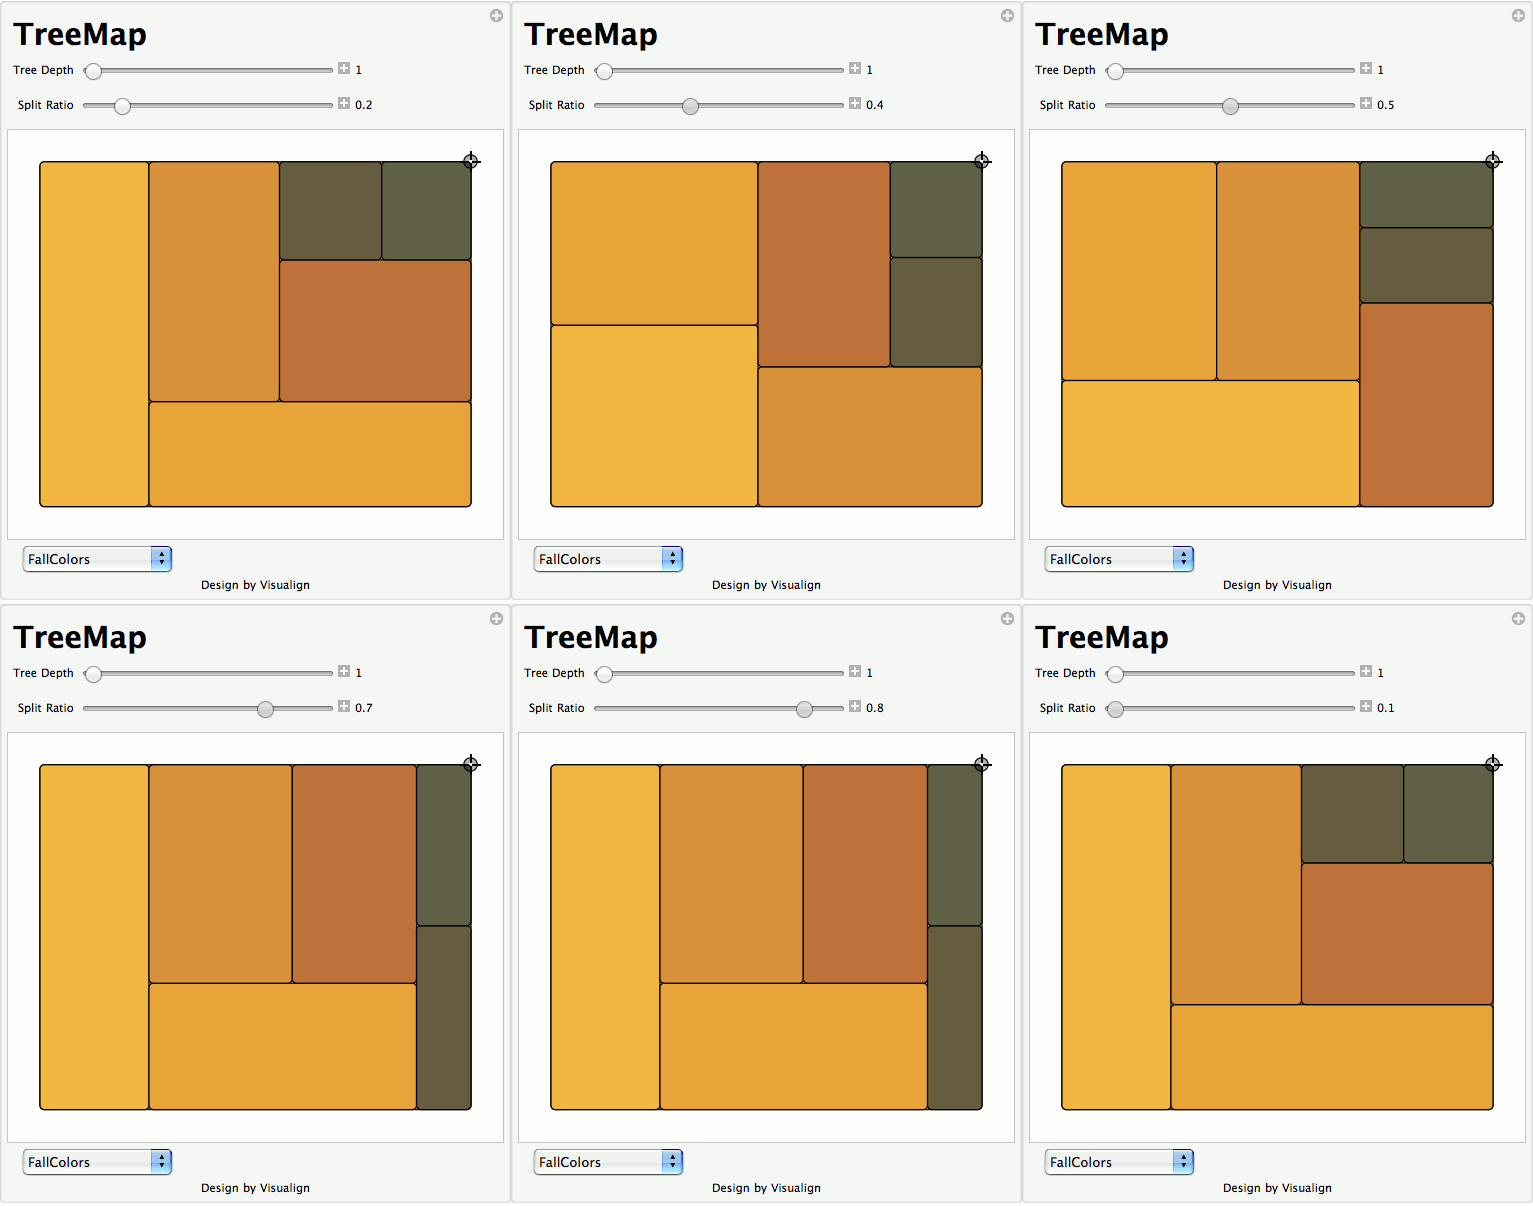
Let's look at the results of such an algorithm. Here I'm using a two-level tree with a branching factor of 6 and random values between 0 (dark) and 100 (bright). The animation is iterating through various split-ratios from 0.1 to 0.9:
Notice how the layout changes as a result of the split-ratio parameter. If it’s near 0 or 1, then we tend to get thinner stripes; when it’s closer to 0.5 we get more square shaped containers (i.e. lower aspect ratios).
The recursive algorithm becomes apparent when we use a tree with two levels. You can still recognize the containers from level 1 which are then sub-divided at level 2:

One of the fundamental tenets of this Blog is that interactive visualizations lead to better understanding of structure in the data or of the dynamic properties of a model. You can interact with this algorithm in the TreeMap model in Computable Document Format (CDF). Simply click on the graphic above and you get redirected to a site where you can interact with the model (requires one-time loading of the free CDF Browser Plug-In). You can change the shape of the outer rectangle, adjust the tree level and split-ratio and pick different color-schemes. The values are shown as Tooltips when you hover over the corresponding rectangle. You also have access to the Mathematica source code if you want to modify it further. Here is a TreeMap with three levels:
Of course a more complete implementation would allow to vary the color-controlling parameter, to filter the values and to re-arrange the dimensions as different levels of the tree. Perhaps someone can start with this Mathematica code and take it to the next level. The previous TreeMap post points to several tools and galleries with interactive applications so you can experiment with that.
Lastly, I wanted to point out a good article by the creator of TreeMaps, Ben Shneiderman. In this 2006 paper called “Discovering Business intelligence Using Treemap Visualizations” he cites various BI applications of TreeMaps. Several studies have shown that TreeMaps allow users to recognize certain patterns in the data (like best and worst performing sales reps or regions) faster than with other more traditional chart techniques. No wonder that TreeMaps are finding their way into more and more tools and Dashboard applications.


visualign
November 30, 2011 at 4:07 pm
I had submitted the Mathematica code for this Treemap to the Wolfram Demonstrations Project. After a lengthy review cycle they have finally accepted and published it here: http://demonstrations.wolfram.com/Treemap/
After a one-time download of the (free) CDF-Plugin you can interact with this demonstration – or with any other form the library of by now more than 7500 demonstrations. (All with source-code and documentation.)
visualign
February 20, 2013 at 9:42 am
Tableau 8 now includes TreeMaps, which can also be used in Bar Charts:
http://www.tableausoftware.com/public/blog/2013/01/treemap-bar-charts-1797