Here is a recipe: Bring together renowned faculties like the MIT Media Lab and Harvard’s Center for International Development. Combine novel ideas about economic measures with years of solid economic research. Leverage large sets of world trade data. Apply network graph theory algorithms and throw in some stunning visualizations. The result: The Atlas of Economic Complexity, a revolutionary way of looking at world trade and understanding variations in countries paths to prosperity.
The main authors are Professors Ricardo Hausmann from Harvard and Cesar Hidalgo from MIT (whose graphic work on Human Development Indices we have reviewed here). The underlying research began in 2006 with the idea of the product space which was published in Science in 2007. This post is the first in a two-part series covering both the atlas (theory, documentation) as well as the observatory (interactive visualization) of economic complexity. This research is an excellent example of how the availability of large amounts of data, computing power and free distribution via the Internet enable entirely new ways of looking at and understanding our world.
The Atlas of Economic Complexity is rooted in a set of ideas about how to measure economies based not just on the quantity of products traded, but also on the required knowledge and capabilities to produce them. World Trade data allows us to measure import and export product quantities directly, leading to indicators such as GDP, GDP per capita, Growth of GDP etc. However, we have no direct way to measure the knowledge required to create the products. A central observation is that complex products require more capabilities to produce, and countries who manufacture more complex products must possess more of these capabilities than others who do not. From Part I of the Atlas:
Ultimately, the complexity of an economy is related to the multiplicity of useful knowledge embedded in it. For a complex society to exist, and to sustain itself, people who know about design, marketing, finance, technology, human resource management, operations and trade law must be able to interact and combine their knowledge to make products. These same products cannot be made in societies that are missing parts of this capability set. Economic complexity, therefore, is expressed in the composition of a country’s productive output and reflects the structures that emerge to hold and combine knowledge.
Can we analyze world trade data in such a way as to tease out relative rankings in terms of these capabilities?
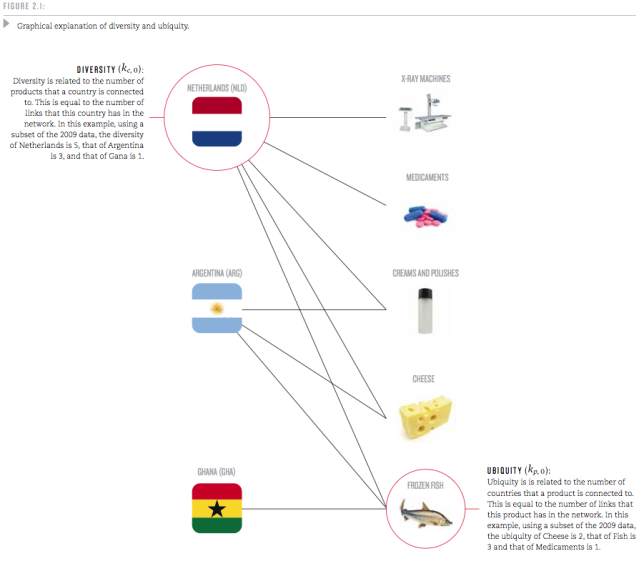
To this end, the authors start by looking at the trade web of countries exporting products. For each country, they examine how many different products it is capable of producing; this is called the country’s Diversity. And for each product, they look at how many countries can produce it; this is called the product’s Ubiquity. Based on these two measures, Diversity and Ubiquity, they introduce two complexity measures: The Economic Complexity Index (ECI, for a country) and the Product Complexity Index (PCI, for a product).
The mechanics of how these measures are calculated are somewhat sophisticated. Yet they encode some straightforward observations and are explained with some examples:
Take medical imaging devices. These machines are made in few places, but the countries that are able to make them, such as the United States or Germany, also export a large number of other products. We can infer that medical imaging devices are complex because few countries make them, and those that do tend to be diverse. By contrast, wood logs are exported by most countries, indicating that many countries have the knowledge required to export them. Now consider the case of raw diamonds. These products are extracted in very few places, making their ubiquity quite low. But is this a reflection of the high knowledge-intensity of raw diamonds? Of course not. If raw diamonds were complex, the countries that would extract diamonds should also be able to make many other things. Since Sierra Leone and Botswana are not very diversified, this indicates that something other than large volumes of knowledge is what makes diamonds rare.
A useful question is this: If a good cannot be produced in a country, where else can it be produced? Countries with higher economic complexity tend to produce more complex products which can not easily be produced elsewhere. The algorithms are specified in the Atlas, but we will skip over these details here. Let’s take a look at the ranking of some 128 world countries (selected above minimum population size and trade volume as well as for reliable trade data availability).
Why is Economic Complexity important? The Atlas devotes an entire chapter to this question. The most important finding here is that ECI is a better predictor of a country’s future growth than many other commonly used indicators that measure human capital, governance or competitiveness.
Countries whose economic complexity is greater than what we would expect, given their level of income, tend to grow faster than those that are “too rich” for their current level of economic complexity. In this sense, economic complexity is not just a symptom or an expression of prosperity: it is a driver.
They include a lot of scatter-plots and regression analysis measuring the correlation between the above and other indicators. Again, the interested reader is referred to the original work.
Another interesting question is how Economic Complexity evolves. In some ways this is like a chicken & egg problem: For a complex product you need a lot of capabilities. But for any capability to provide value you need some products that require it. If a new product requires several capabilities which don’t exist in a country, then starting the production of such a product in the country will be hard. Hence, a country’s products tend to evolve along the already existing capabilities. Measuring the similarities in required capabilities directly would be fairly complicated. However, as a first approximation, one can deduce that products which are more often produced by the same country tend to require similar capabilities.
So the probability that a pair of products is co-exported carries information about how similar these products are. We use this idea to measure the proximity between all pairs of products in our dataset (see Technical Box 5.1 on Measuring Proximity). The collection of all proximities is a network connecting pairs of products that are significantly likely to be co-exported by many countries. We refer to this network as the product space and use it to study the productive structure of countries.
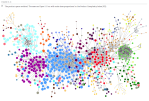
Then the authors proceed to visualize the Product Space. It is a graph with some 774 nodes (products) and edges representing the proximity values between those nodes. Only the top 1% strongest proximity edges are shown to keep the average degree of the graph below 5 (showing too many connections results in visual complexity). Network Science Algorithms are used to discover the highly connected communities into which the products naturally group. Those 34 communities are then color-coded. Using a combination of Minimum-Spanning-Tree and Force-Directed layout algorithms the network is then laid out and manually optimized to minimize edge crossings. The resulting Product Space graph looks like this:
Here the node size is determined by world trade volume in the product. If you step back for a moment and reflect on how much data is aggregated in such a graph it is truly amazing! One variation of the graph determines size by the Product Complexity as follows:
In this graph one can see that products within a community are of similar complexity, supporting the idea that they require similar capabilities, i.e. have high proximity. From these visualizations one can now analyze how a country moves through product space over time. Specifically, in the report there are graphs for the four countries Ghana, Poland, Thailand, and Turkey over three points in time (1975, 1990, 2009). From the original document I put together a composite showing the first two countries, Ghana and Poland.
While Ghana’s ECI doesn’t change much, Poland grows into many products similar to those where they started in 1975. This clearly increases Poland’s ECI and contributes to the strong growth Poland has seen since 1975. (Black squares show products produced by the country with a Revealed Comparative Advantage RCA > 1.0.)
In all cases we see that new industries –new black squares– tend to lie close to the industries already present in these countries. The productive transformation undergone by Poland, Thailand and Turkey, however, look striking compared to that of Ghana. Thailand and Turkey, in particular, moved from mostly agricultural societies to manufacturing powerhouses during the 1975-2009 period. Poland, also “exploded” towards the center of the product space during the last two decades, becoming a manufacturer of most products in both the home and office and the processed foods community and significantly increasing its participation in the production of machinery. These transformations imply an increase in embedded knowledge that is reflected in our Economic Complexity Index. Ultimately, it is these transformations that underpinned the impressive growth performance of these countries.
The Atlas goes on to provide rankings of countries along five axes such as ECI, GDP per capita Growth, GDP Growth etc. The finding that higher ECI is a strong driver for GDP growth allows for predictions about GDP Growth until 2020. In that ranking there are Sub-Saharan East Africa countries on the top (8 of the Top 10), led by Uganda, Kenya and Tanzania. Here is the GDP Growth ranking in graphical form – the band around the Indian Ocean is where the most GDP Growth is going to happen during this decade.
Each country has its own Product Space map. It shows which products and capability sets the country already has, which other similar products it could produce with relatively few additional capabilities and where it is more severely lacking. As such it can provide both the country or a multi-national firm looking to expand with useful information. The authors sum up the chapter on how this Atlas can be used as follows:
A map does not tell people where to go, but it does help them determine their destination and chart their journey towards it. A map empowers by describing opportunities that would not be obvious in the absence of it. If the secret to development is the accumulation of productive knowledge, at a societal rather than individual level, then the process necessarily requires the involvement of many explorers, not just a few planners. This is why the maps we provide in this Atlas are intended for everyone to use.
We will look at the rich visualizations of the data sets in this Atlas in a forthcoming second installment of this series.


6 responses to “The Atlas of Economic Complexity”